

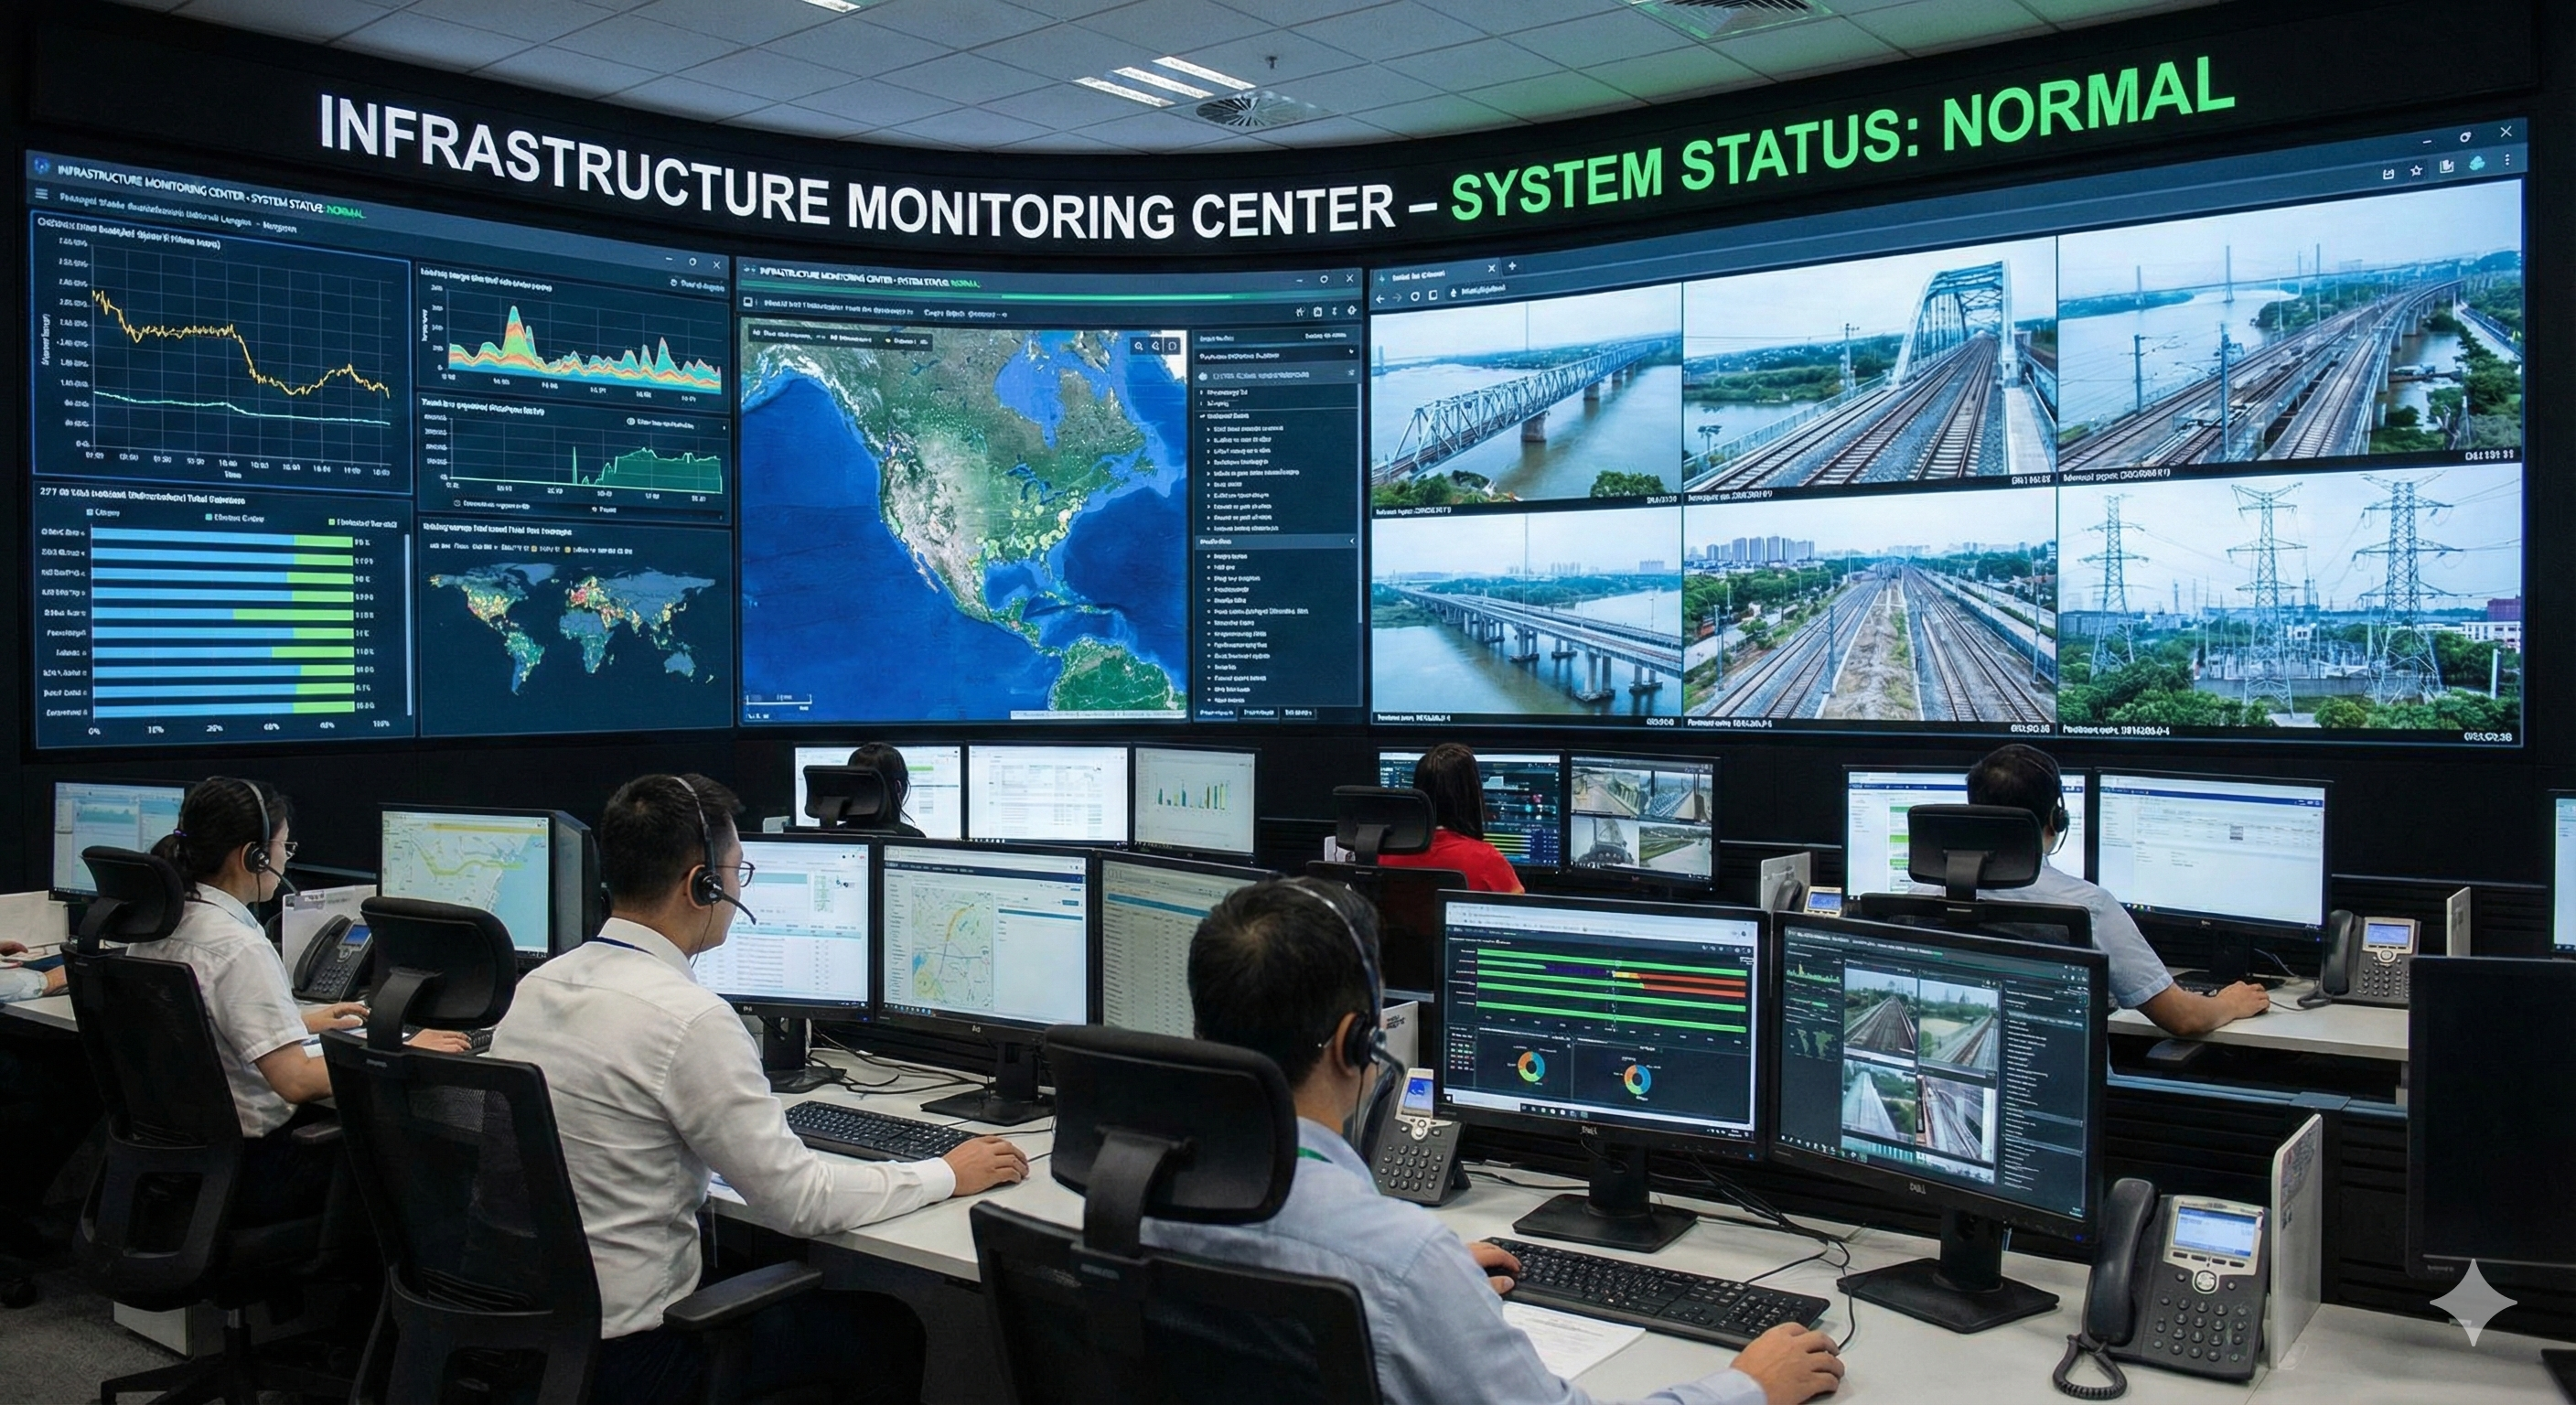
Infrastructure Condition Monitoring Dashboards
The infrascan.ai client portal unifies real-time structural health monitoring (SHM), AI-powered analytics, and drone-based inspections into a single, engineering-grade workspace.
Instead of periodic manual inspections and static PDF reports, asset owners and engineers receive a live, continuously updated digital picture of their infrastructure — bridges, industrial facilities, pipelines, powerlines, and flood-exposed buildings — refreshed every few seconds.
High-Level Benefits for Asset Owners & Engineers
System Architecture & Data Flow
Step 1 – Data Capture Layer
Sensors, IoT devices, and external data sources stream live measurements (loads, vibration, climate, corrosion, traffic, electrical parameters). Drones and Leica LiDAR scanners periodically contribute high-precision 3D geometry and thermal imagery.
Step 2 – SHM Dashboards & Engineering Metrics
Each asset (bridge, hangar, pipeline, powerline, building) has its own engineering dashboard with carefully defined metrics, indices, and alarm thresholds. All metrics update in near real time (1–10 seconds), providing a continuously refreshed view of structural and operational behavior.
Step 3 – AI & Drone-Assisted Diagnostics
The infrascan.ai AI co-pilot continuously analyzes dashboard signals, anomaly patterns, and event logs, acting as a virtual assistant for the engineering team. When required, drone missions are triggered to provide a visual and LiDAR-based “second opinion” for critical zones and suspected defects.
AI Co-Pilot & Drone Second Opinion
Every dashboard inside the client portal is connected to an AI analysis layer. The AI engine reviews time series, thresholds, indices, and event logs, behaving like a virtual co-engineer focused on pattern recognition and prioritization.
The AI co-pilot does not replace the engineer — it prioritizes attention, reduces manual log review, and transforms raw telemetry into actionable engineering insights.
Drone & LiDAR as a Verification Layer
When the AI engine flags abnormal behavior, infrascan.ai can trigger drone-based inspections and Leica LiDAR scans to:
Asset Dashboards in the Client Portal
Each of the dashboards below is a live, clickable view inside the infrascan.ai portal. When a client clicks a dashboard name, they are taken directly to the real-time SHM interface for that asset.
Integrated real-time diagnostics for suspension, cable-stayed, and segmental bridge systems. Designed for DOTs, concessionaires, and bridge owners.
Key Engineering Parameters Monitored
AI & Drone-Assisted Benefits for Bridge Owners
WHY CORROSION MONITORING MATTERS?
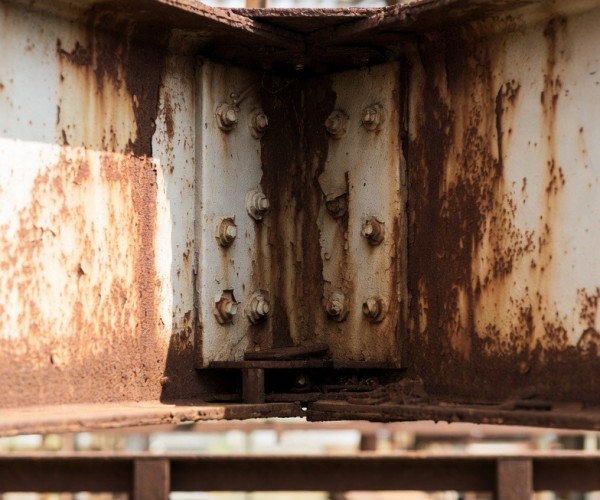
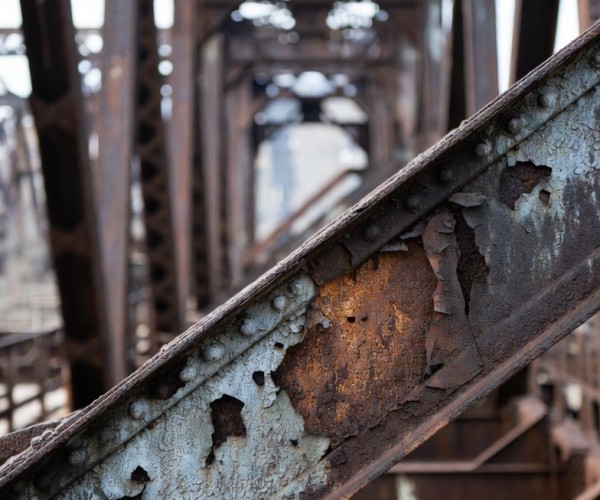
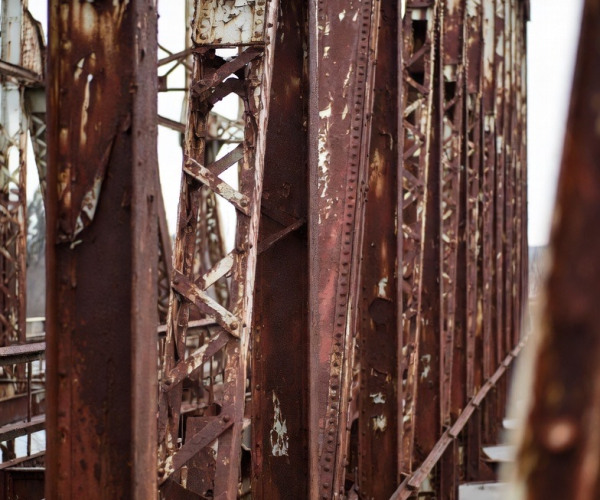
Corrosion is not just about “rust on steel”. When steel elements lose thickness year after year, the bridge slowly loses its safety margin. Bolts, gusset plates, cable anchor zones, bearings – all of them can weaken without showing dramatic visible damage at first.
If this process is not monitored, you get three risks at the same time:
Safety risk – reduced load-bearing capacity, higher probability of cracks, local failures or, in the worst case, partial collapse.
Operational risk – unplanned lane closures, emergency repairs, traffic restrictions and reputational damage for the owner.
Financial risk – instead of planned maintenance, you pay for emergency works, night mobilizations, penalties and, potentially, legal claims.
The important point: corrosion is a slow process, but the decision point often comes suddenly – when an inspection finally discovers that “it’s already too late”.
That’s why continuous monitoring is critical. If we track corrosion indicators, humidity, saline exposure, vibration and load in real time, we can see the trend early, prioritize the exact zones that need attention, and fix problems with a small intervention before they become a big structural and financial event.
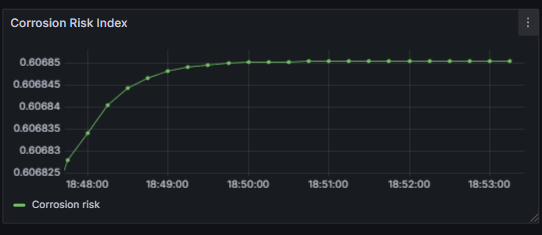
INTERPRETING THE CORROSION RISK INDEX
Corrosion Risk Index over time for a critical bridge element. The X-axis shows time, the Y-axis shows the normalized Corrosion Risk Index on a 0–1 scale. In this example, the index quickly rises and stabilizes around 0.61, indicating a steady, elevated corrosion risk level in this zone. If the curve moves further upward and crosses a defined threshold, the system will flag the element for engineering review and, if needed, recommend a targeted inspection or drone survey.
Real-time condition monitoring for industrial buildings, logistics centers, warehouses, factories, data centers, and multi-building industrial sites.
Key Engineering Parameters Monitored
Why Electrical Panel Overheating Is Dangerous?
Overheating inside electrical panels is not just “slightly high temperature”. When panel temperature and local hotspots gradually increase over time, insulation ages faster, connections loosen, and breakers stop operating exactly as designed. This silently reduces the safety margin of the entire electrical system.
If this process is not monitored, you face three types of risk:
This is why continuous monitoring of panel temperature and overheat risk is critical. By tracking the panel temperature curve together with a normalized Overheat Risk Index (0–100), the dashboard shows when a panel is operating within a healthy range and when temperature trends indicate overloaded feeders, poor ventilation, loose connections or phase imbalance — long before a failure or fire occurs.
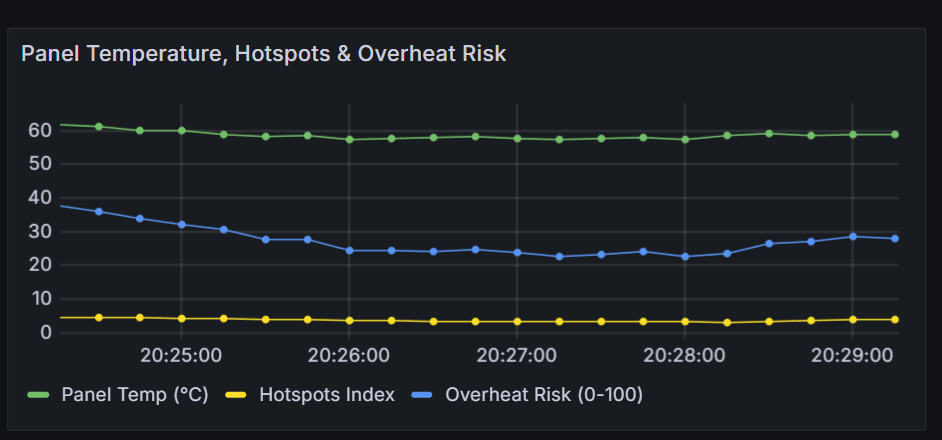
INTERPRETING PANEL TEMPERATURE & OVERHEAT RISK
Panel Temperature, Hotspots & Overheat Risk over time. The X-axis shows time. The green line is Panel Temperature (°C), the yellow line is the Hotspots Index, and the blue line shows the Overheat Risk (0–100). In this example, panel temperature remains in a relatively stable range, while the Overheat Risk slowly increases toward the end of the period, indicating a growing thermal load on the panel. If the blue curve continues to rise and crosses the predefined threshold, the system will flag this panel for engineering review and may recommend a targeted inspection before overheating leads to failures or fire risk.
Operational & Safety Advantages
High-resolution analytics for overhead powerlines, towers, insulators, and the full transmission corridor.
Key Engineering Parameters Monitored
Why Conductor Temperature & Ice Load Matter
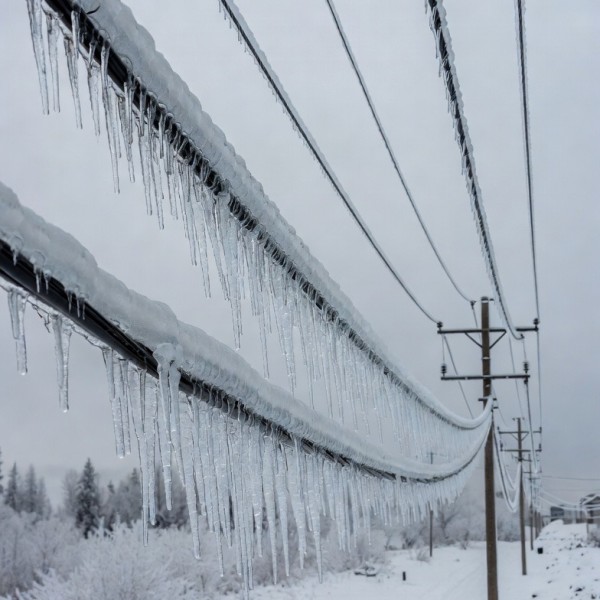
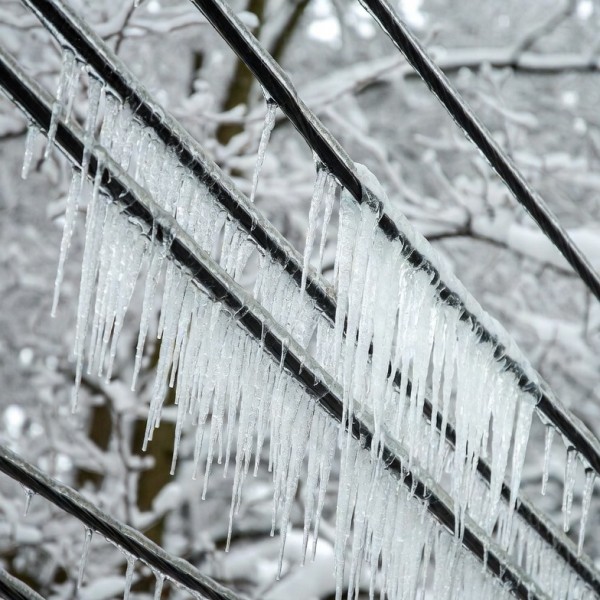
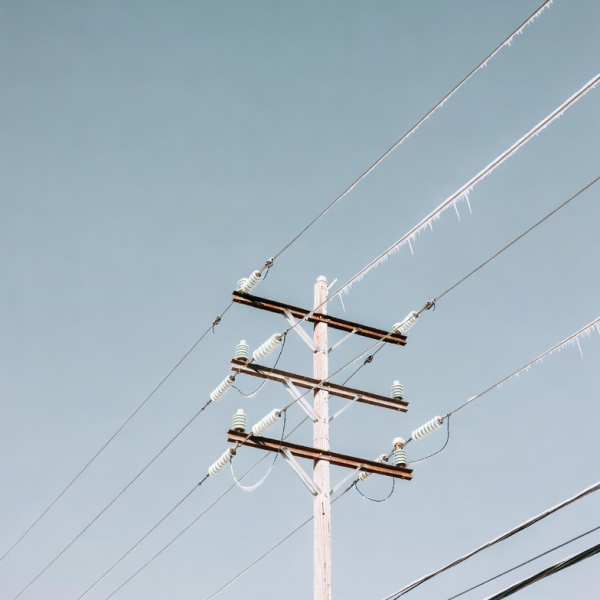
Conductor temperature and ice load directly control the mechanical and electrical safety of a powerline. When the wire overheats, it sags, loses clearance to the ground and other objects, and its ageing accelerates. When ice builds up on the conductor, the extra weight dramatically increases tension in the span and loads on towers and fittings.
If these parameters are not monitored, several risks appear at the same time:
Continuous monitoring of conductor temperature and ice load is therefore critical. The dashboard shows how thermal conditions and icing evolve over time, so operators can identify dangerous combinations early, adjust loading or line rating, and, if necessary, dispatch inspections before a failure occurs.
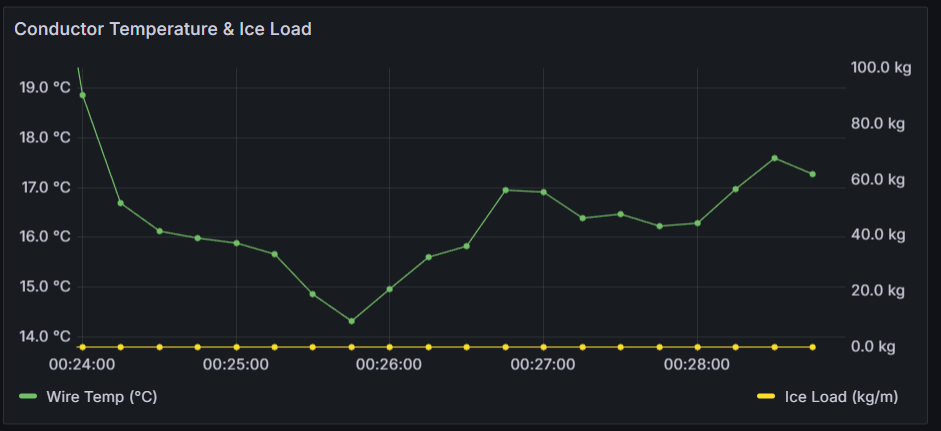
INTERPRETING CONDUCTOR TEMPERATURE & ICE LOAD
Conductor Temperature & Ice Load over time. The X-axis shows time. The green line is Wire Temperature (°C), the yellow line is the Ice Load (kg/m). In this example, the ice load remains essentially at zero for the entire period, indicating no active icing on the conductor. The wire temperature slowly rises from about 14–15 °C to around 18 °C, staying within a normal operating range. This pattern represents a thermally stable line with no additional mechanical load from ice, which is a healthy condition for the span at this moment in time.
Reliability & Risk Reduction Benefits
Real-time diagnostics for buildings exposed to flooding, storm surge, extreme moisture, and other disaster-related impacts.
Key Engineering Parameters Monitored
Why Foundation Settlement & Differential Matter
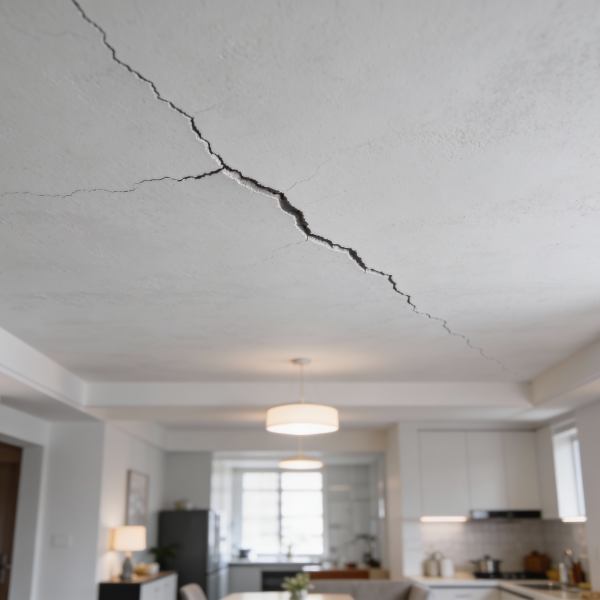
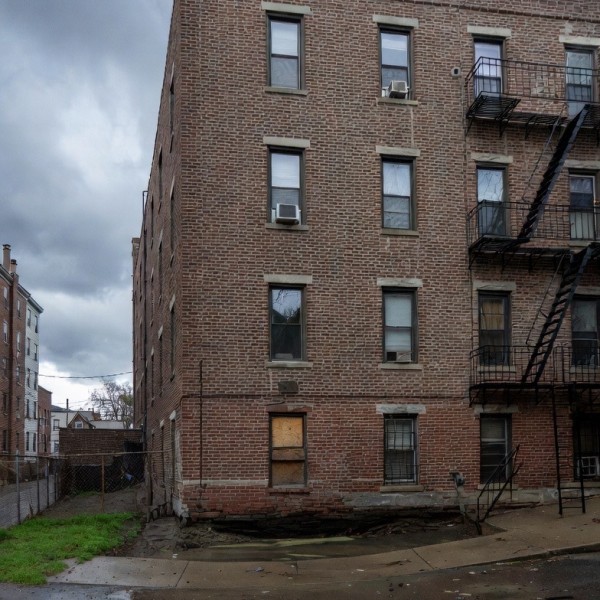
For flood-affected or moisture-exposed buildings, foundation settlement is one of the key indicators of long-term structural safety. When the entire foundation slowly moves downward, or when different parts of the building settle at different rates, walls, columns and slabs begin to crack, tilt and lose alignment.
If settlement is not monitored, several risks appear at the same time:
Continuous tracking of total settlement, differential settlement and settlement rate via the dashboard is essential. It allows engineers to distinguish between a stabilised, slowly settling foundation and an active, uneven settlement process that requires investigation, load management or ground improvement before serious damage develops.
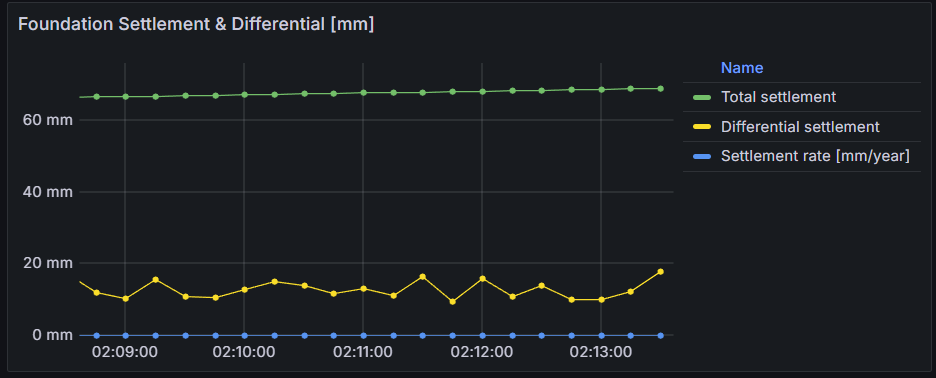
Foundation Settlement & Differential over time. The X-axis shows time. The green line is Total settlement (mm), which remains almost flat around 65–67 mm, indicating that the building has already settled to this level and is not moving rapidly at the moment. The yellow line shows Differential settlement (mm), fluctuating roughly between 10 and 18 mm — different parts of the foundation are settling by different amounts, but without sudden jumps in this interval. The blue line represents the Settlement rate (mm/year), staying close to zero, which suggests a slow, stabilised process rather than active accelerating settlement. If the yellow or blue curves were to rise sharply and cross predefined thresholds, the system would flag this foundation zone for detailed engineering review and possible stabilisation measures.
Resilience & Post-Disaster Assessment Benefits
Full-spectrum diagnostics for oil and gas pipelines — including transmission, gathering, and distribution systems.
Key Engineering Parameters Monitored
Why Leak Risk vs Stress Load Matters
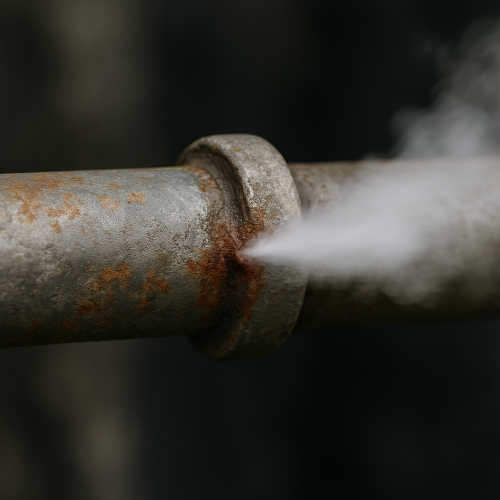
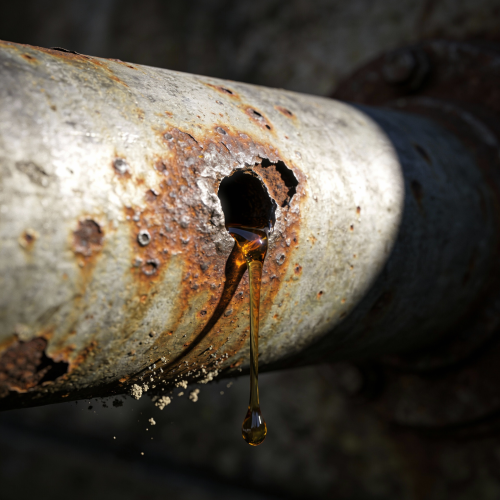
For oil & gas pipelines, leak risk is never just a random event – it is strongly linked to how much mechanical and pressure stress the pipe is carrying over time. When pressure cycles, bending, vibration and temperature drive the stress level higher, existing defects (microcracks, corrosion pits, weld flaws) are more likely to grow into real leaks.
If stress and leak risk are not monitored together, several risks appear at the same time:
The dashboard correlates a normalized Leak Risk Index with a Stress Load Index for each segment. This allows engineers to see not only how “stressed” the pipe is, but also how close it is to conditions where a leak becomes statistically more probable – and to prioritise inspections, pressure optimisation or mitigation measures before an incident occurs.
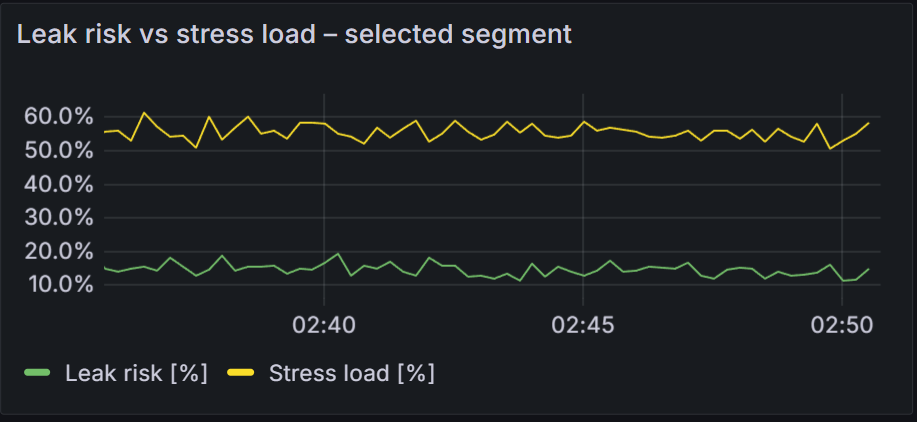
Leak Risk vs Stress Load for a selected pipeline segment. The X-axis shows time. The yellow line represents the Stress Load Index (%), which stays in a relatively high but stable band around 55–60%, indicating that this segment is operating under significant mechanical and pressure stress. The green line shows the Leak Risk Index (%), fluctuating around 12–18% in the same period. This means that, although the pipe is working under a sustained high load, the current leak probability remains in a lower, controlled range. If the green curve were to start rising and track the higher stress levels, the system would flag this segment as a priority for integrity checks, pressure optimisation or targeted field inspection.
Integrity Management & Risk Mitigation Benefits
High-Precision LiDAR & 3D Engineering Reports
Measurement Capabilities & Accuracy
Engineering Deliverables & Formats
These reports form a digital passport of the asset and feed directly into the SHM dashboards, enabling AI to reason not only about sensor data, but also about real geometry and deformation.
